5. 2019 Halloween Storm
The 2019 Halloween storm struck the eastern U.S. cities with wind gusts, thunderstorms, and flash flooding.
5.1. Model Configuration and Datasets
The UFS Medium-Range Weather (MRW) Application (App) is used to prepare initial conditions, compile and run the UFS model, and post process the raw model outputs. Two model configuration compsets (GFSv15p2 and GFSv16beta) are tested using the C768 (~13km) spatial resolution with 64 vertical levels (default).
The case runs are initialized at 12z Oct 25, 2019 with 120 hours forecasting. The corresponding namelist options that need to be changed are listed below. The app uses ./xmlchange to change the runtime settings. The settings that need to be modified to set up the start date, start time, and run time are listed below.
./xmlchange RUN_STARTDATE=20191025,START_TOD=43200,STOP_OPTION=nhours,STOP_N=120
Warning
The model run time step is reduced from the default 225s to 150s in this case due to the model instability in GFSv16beta. To set the time step, add dt_atmos=150 to user_nl_ufsatm
Initial condition (IC) files are created from GFS operational dataset in NEMSIO format. The GFS analysis dataset are used as ‘truth’ to compare with simulation results.
The GFS model EMC global workflow points to the most up-to-date GFS model development code. The GFS.v16.0.10 is tested in C768 (~13km) resolution and in 128 vertical levels. It uses two scripts, setup_expt.py and setup_workflow_fcstonly.py to set up the mode simulation date and case directories.
The case runs are initialized at 12z Oct 25, 2019 with 120 hours forecasting. The settings that need to be modified to set up the start date and directories are listed below.
./setup_expt.py forecast-only --pslot 2019Halloween --configdir /PATH/TO/YOUR/GLOBAL/WORKFLOW/parm/config --idate 2019102512 --edate 2019102512 --res 768 --comrot /PATH/TO/YOUR/EXP/DIR/comrot --expdir /PATH/TO/YOUR/EXP/OUTPUT/expdir
The account and simulation duration time can be set up in /expdir/2019Halloween/config.base file.
./setup_workflow_fcstonly.py --expdir /PATH/TO/YOUR/OUTPUT/expdir/2019Halloween
Next step is to go to /expdir/2019Halloween to submit the run by
crontab 2019Halloween.crontab
The UFS Short-Range Weather (SRW) Application (App) is used to prepare initial conditions, compile and run the UFS model, and postprocess the raw model outputs. Two model configuration compsets (GFSv15p2 and RRFSv1alpha) are tested using the C768 (~13km) spatial resolution with 64 vertical levels (default).
The case was initialized at 12z Oct 28, 2019 and forecast out to 90 hours. The app uses config.sh to define the runtime settings. The settings that need to be modified to set up the first cycle, last cycle, forecast length and cycle hour are listed below.
FCST_LEN_HRS="90"
LBC_SPEC_INTVL_HRS="3"
DATE_FIRST_CYCL="20191028"
DATE_LAST_CYCL="20191028"
CYCL_HRS=( "12" )
Initial condition (IC) and boundary condition (BC) files are created from GFS operational dataset in NEMSIO format. The RAP reanalysis dataset (RAP_ANL) are used as ‘truth’ to compare with simulation results.
5.2. Case Results
5.2.1. Synoptic Dynamics
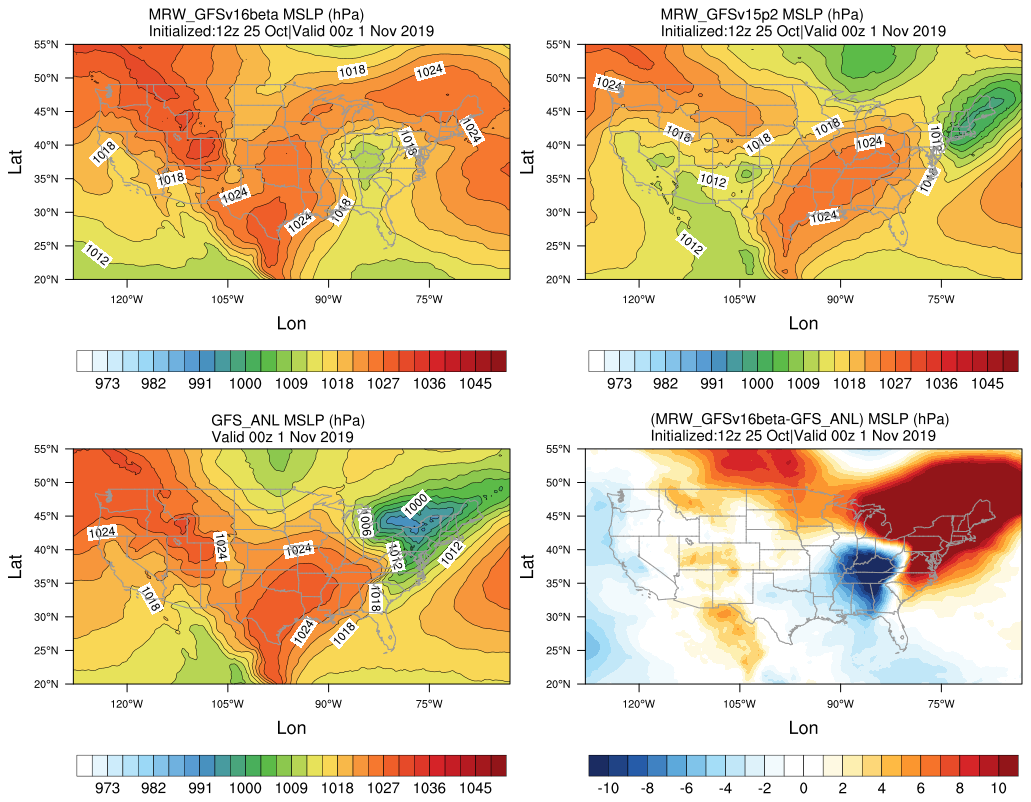
Mean sea-level pressure (MSLP, hPa)
MRW_GFSv15p2 simulates the sea level pressure structure more reasonably than MRW_GFSv16beta.
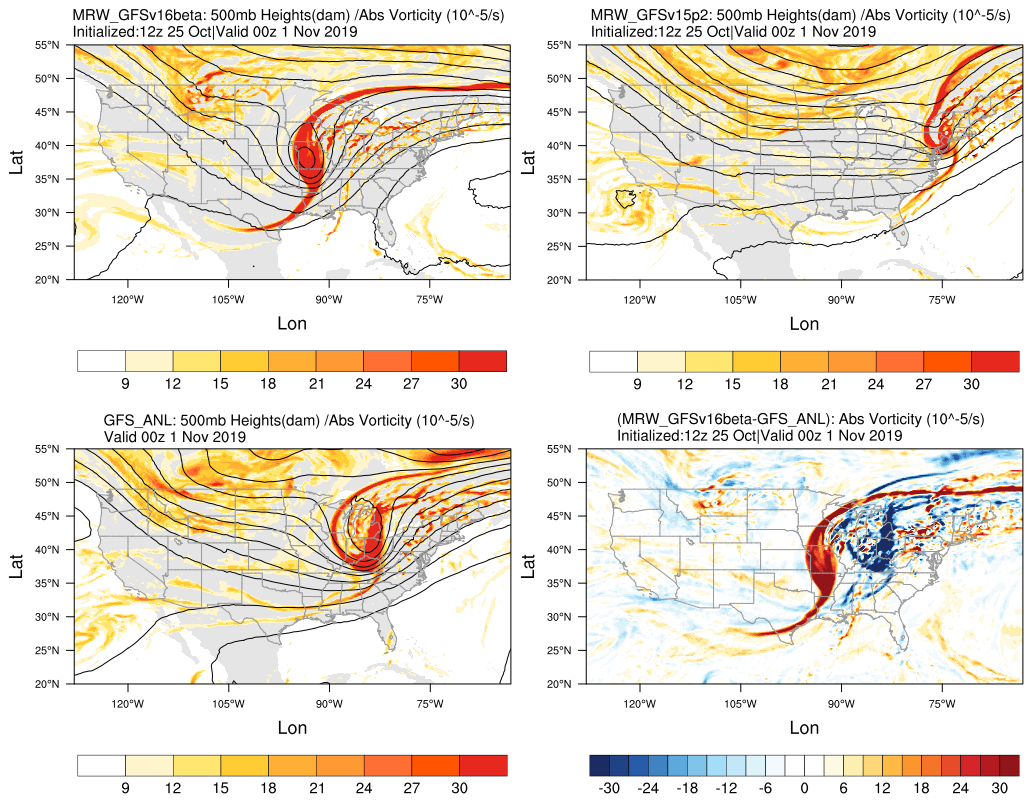
500 hPa geopotential heights (dam) and absolute vorticity (10 -5/s)
MRW_GFSv15p2 generates a progressive synoptic pattern compared with reanalysis data.
MRW_GFSv16beta alleviates the progressiveness of synoptic pattern.
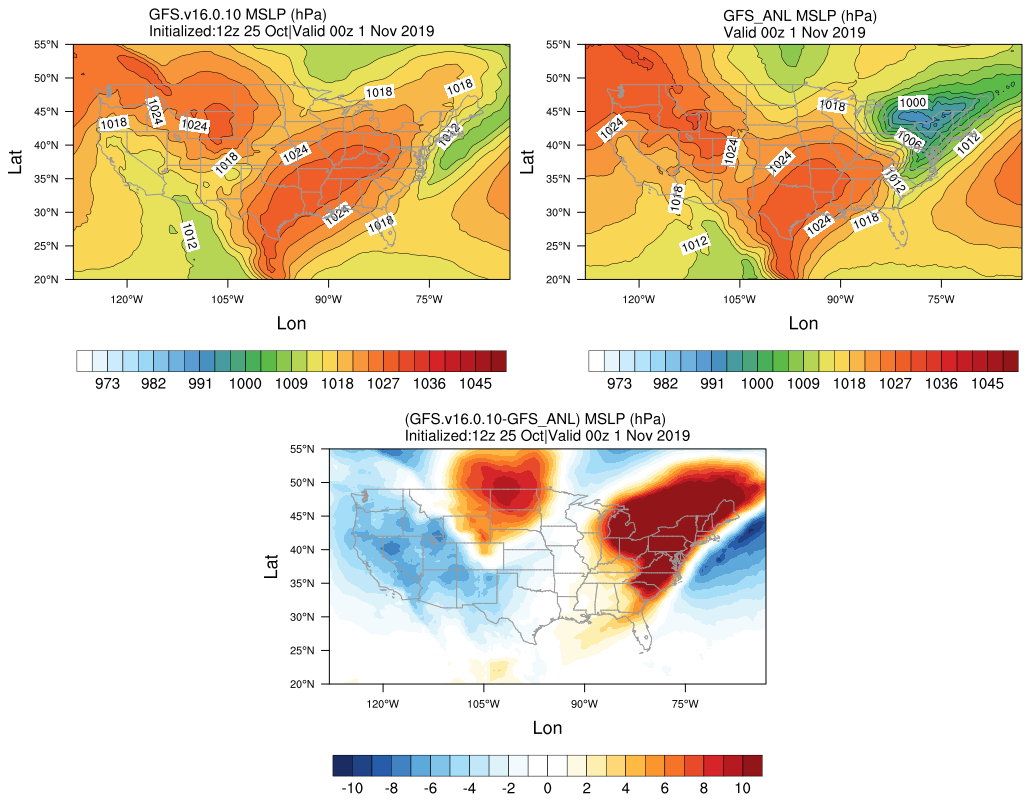
Mean sea-level pressure (MSLP, hPa)
The strength of sea level pressure gradient is weaker in GFS.v16.0.10 over the Northeastern U.S.
Higher sea level pressure controls the U.S. east coast in GFS.v16.0.10.
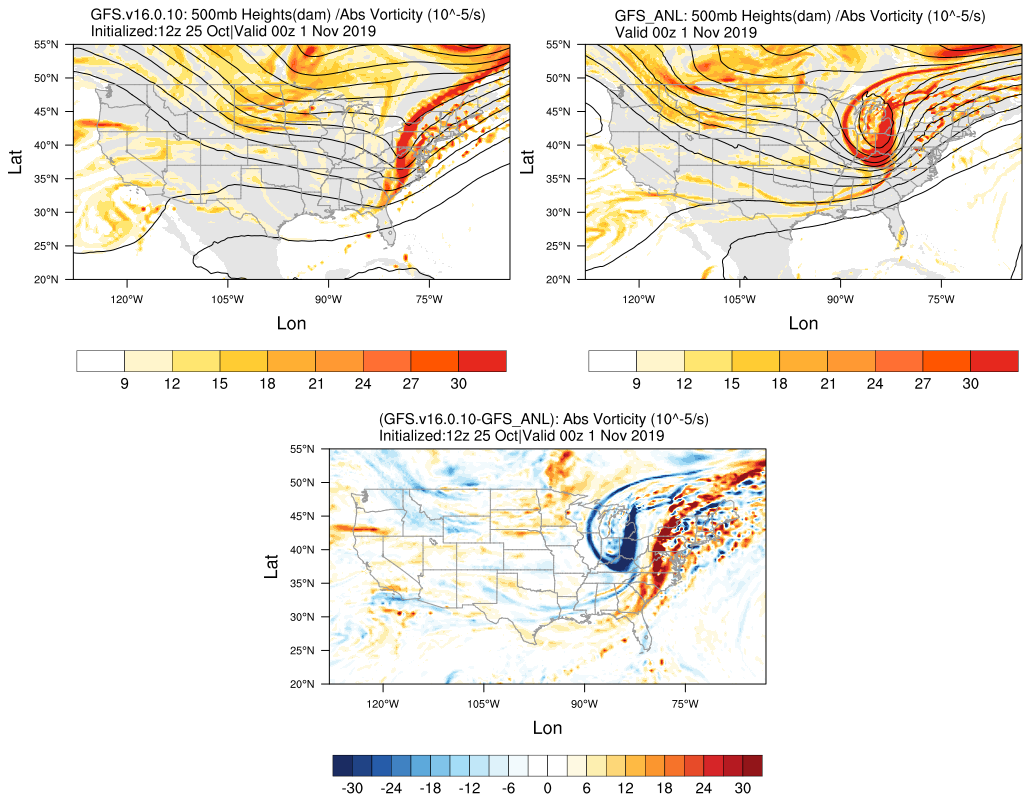
500 hPa geopotential heights (dam) and absolute vorticity (10 -5/s)
GFS.v16.0.10 generates a progressive synoptic pattern compared with reanalysis data.
The positive tilted trough in GFS.v16.0.10, versus the negative tilted trough in GFS_ANL, indicates a less severe storm over the eastern U.S.
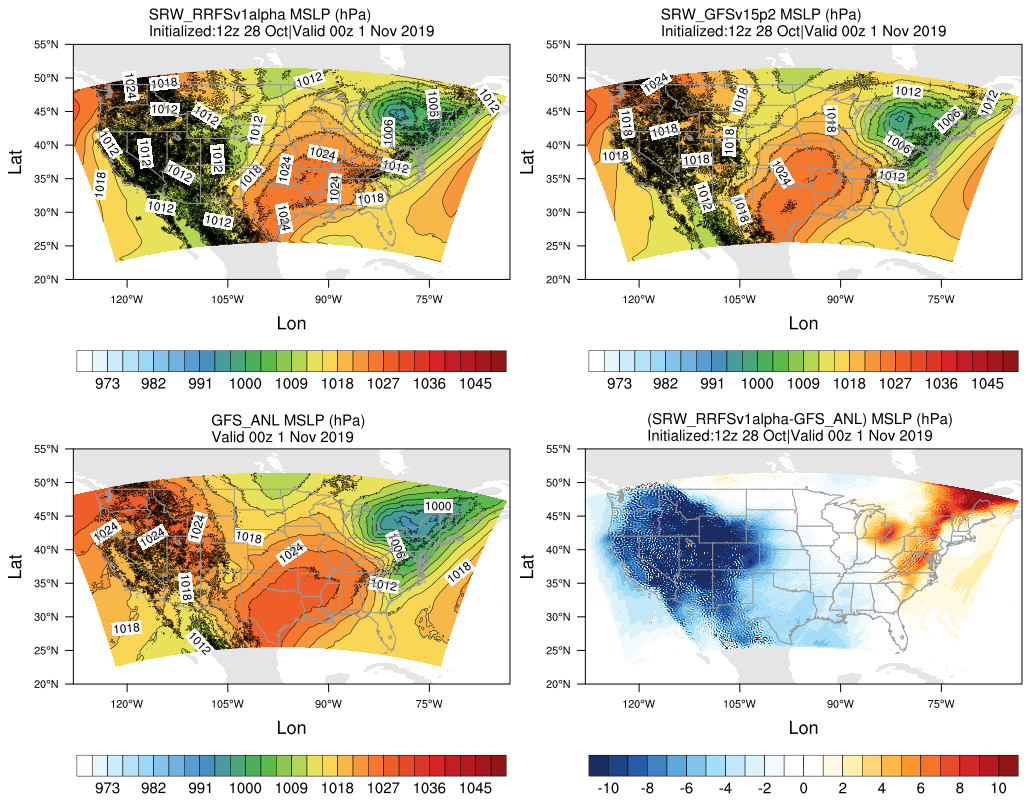
Mean sea-level pressure (MSLP, hPa)
SRW_GFSv15p2 simulates the sea level pressure structure better than SRW_RRFSv1alpha. The MSLP from SRW_RRFSv1alpha is very noisy over Rocky mountain area.

500 hPa geopotential heights (dam) and absolute vorticity (10 -5/s)
The trough position is well represented in SRW_GFSv15p2 and SRW_RRFSv1alpha
The results over Rocky mountain are noisy for both SRW_GFSv15p2 and SRW_RRFSv1alpha.
5.2.2. Surface Temperature and Wind Speed
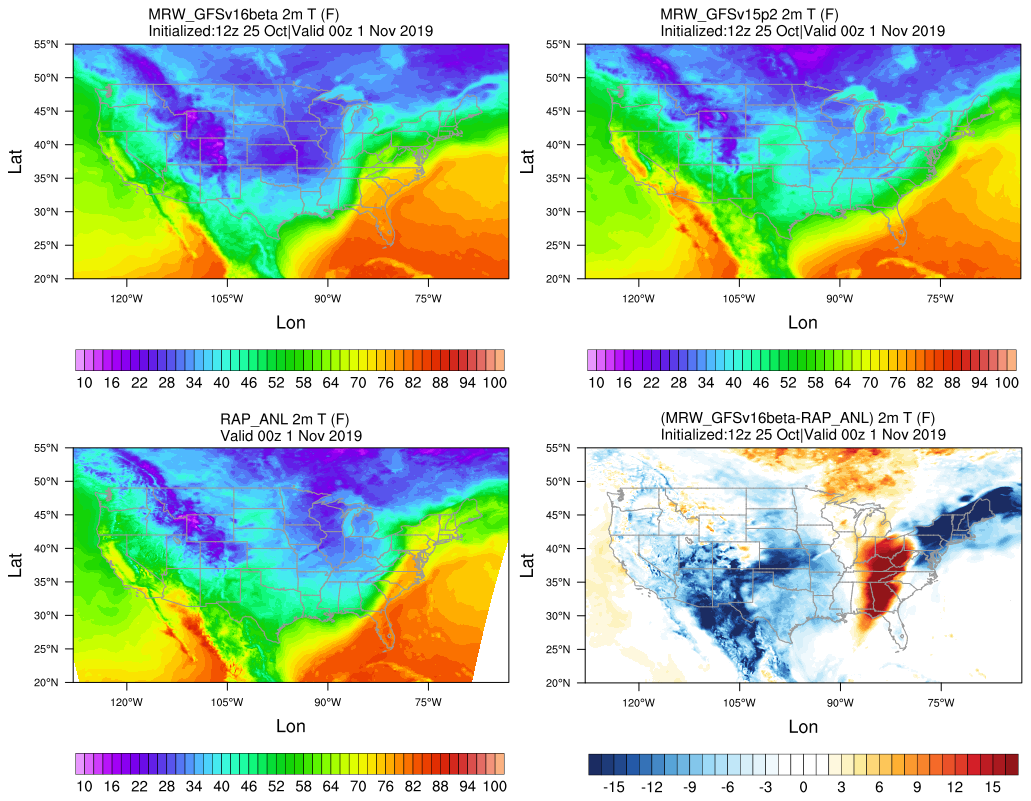
2-m temperature (F) valid at 00z 1 Nov 2019
Colder 2-m T in MRW_GFSv15p2 along the U.S. east coast compared with RAP_ANL.
Colder 2-m T at New England and warmer 2-m T at the Southeast in MRW_GFSv16beta.
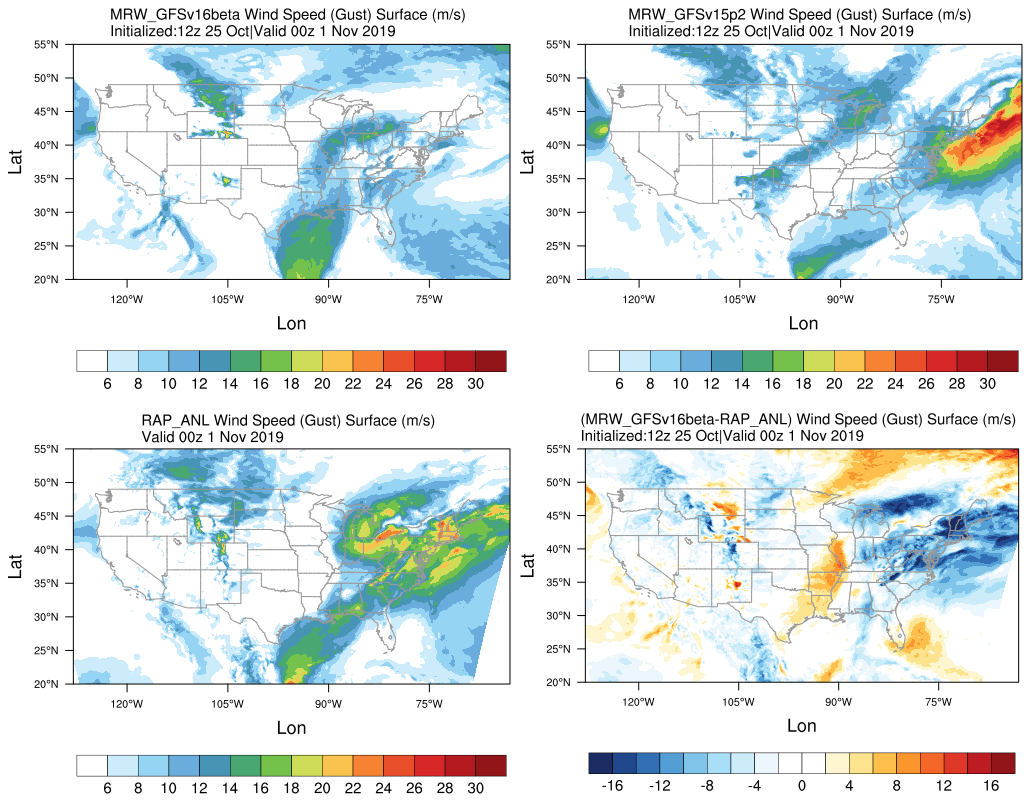
Surface gust (m/s) valid at 00z 1 Nov 2019
Negative biases of surface gust over the eastern U.S. for both MRW_GFSv15p2 and MRW_GFSv16beta compared with RAP_ANL.
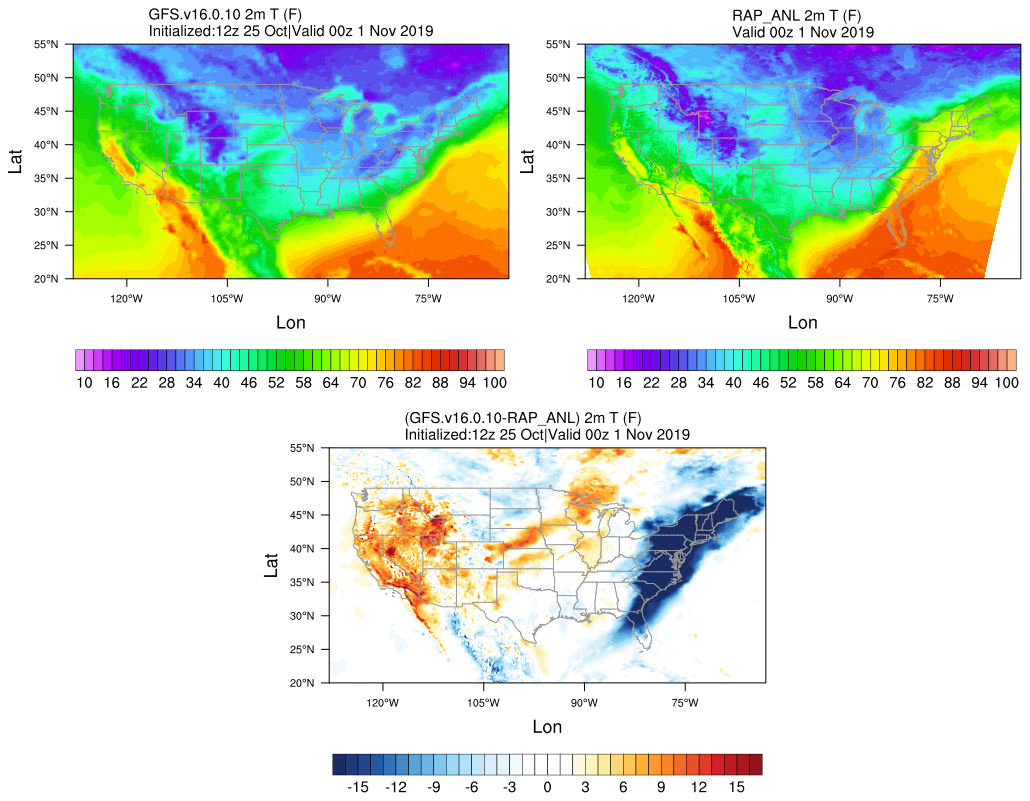
2-m temperature (F) valid at 00z 1 Nov 2019
Colder 2-m T in GFS.v16.0.10 along the U.S. east coast compared with RAP_ANL.
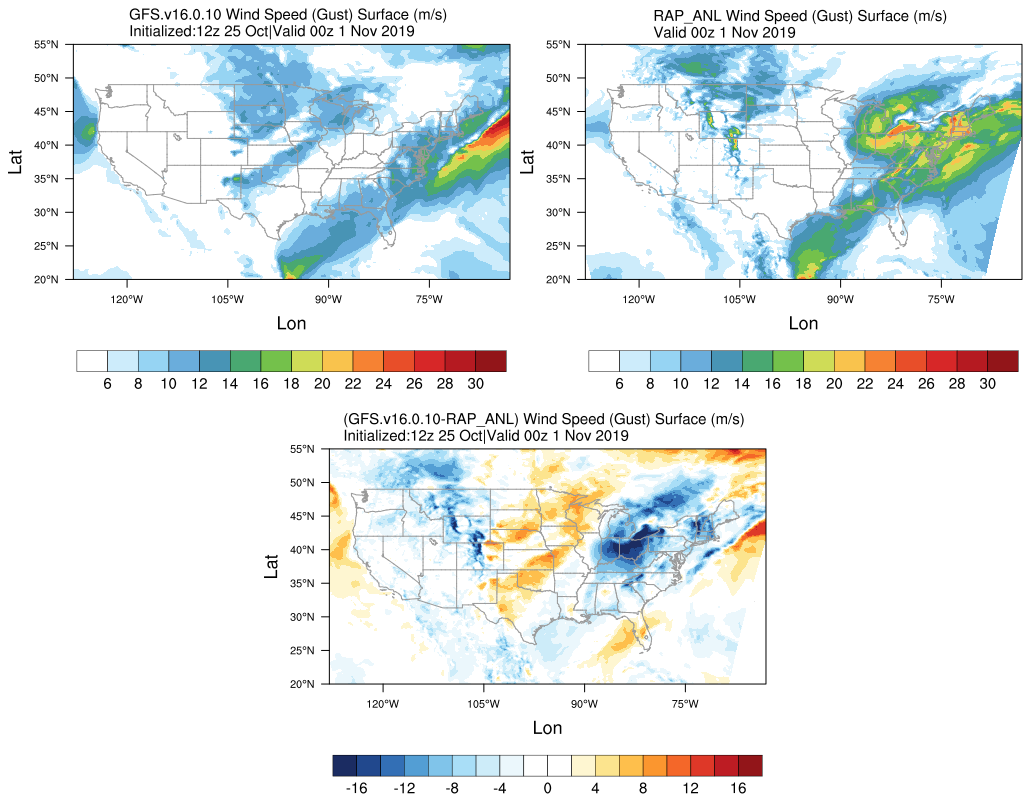
Surface gust (m/s) valid at 00z 1 Nov 2019
GFS.v16.0.10 does not capture the surface gust at the Great Lakes Region, accompanied by a faster-moving and narrower trough compared with analysis data.

2-m temperature (F) valid at 00z 1 Nov 2019
Colder 2-m T in SRW_RRFSv1apha along the U.S. northeast coast compared with RAP_ANL.
Warmer 2-m T in SRW_RRFSv1alpha at central and eastern U.S.
Colder 2-m T at New England and warmer 2-m T at the Northwest in SRW_GFSv15p2.

Surface gust (m/s) valid at 00z 1 Nov 2019
Negative biases of surface gust over the eastern U.S. for both SRW_GFSv15p2 and SRW_RRFSv1alpha compared with RAP_ANL.
5.2.3. Moisture/Precipitation
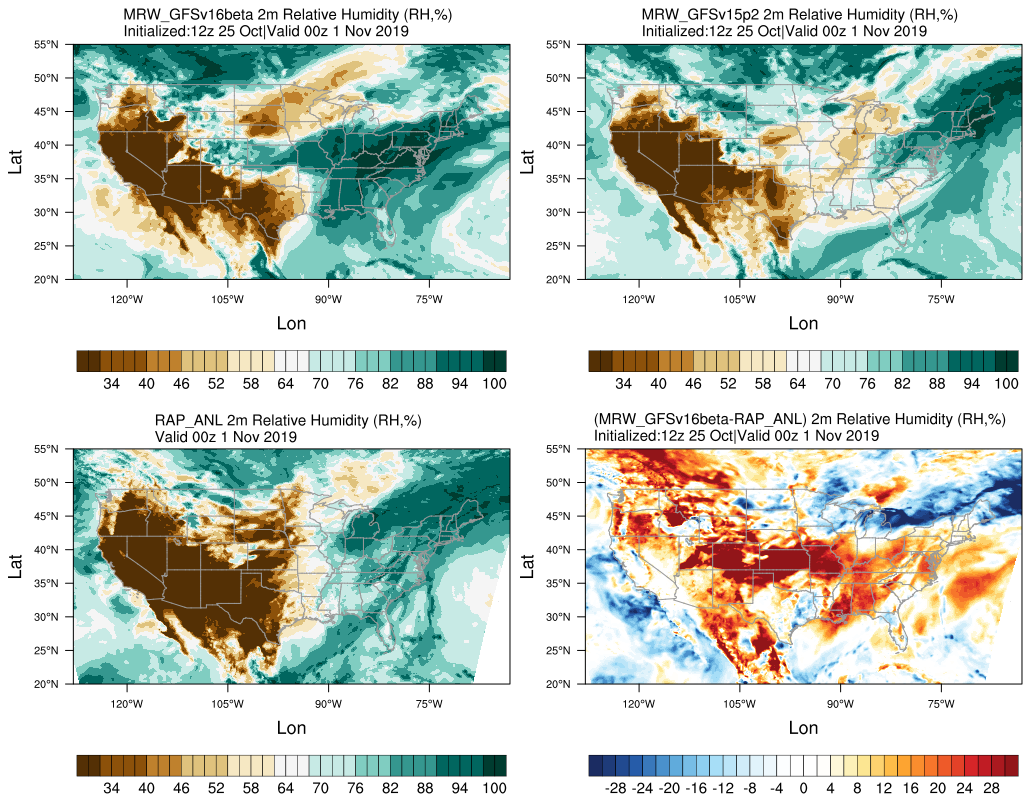
2-m relative Humidity (RH,%) valid at 00z 1 Nov 2019
Dryline across the central U.S. is not simulated well in the two physics compsets.
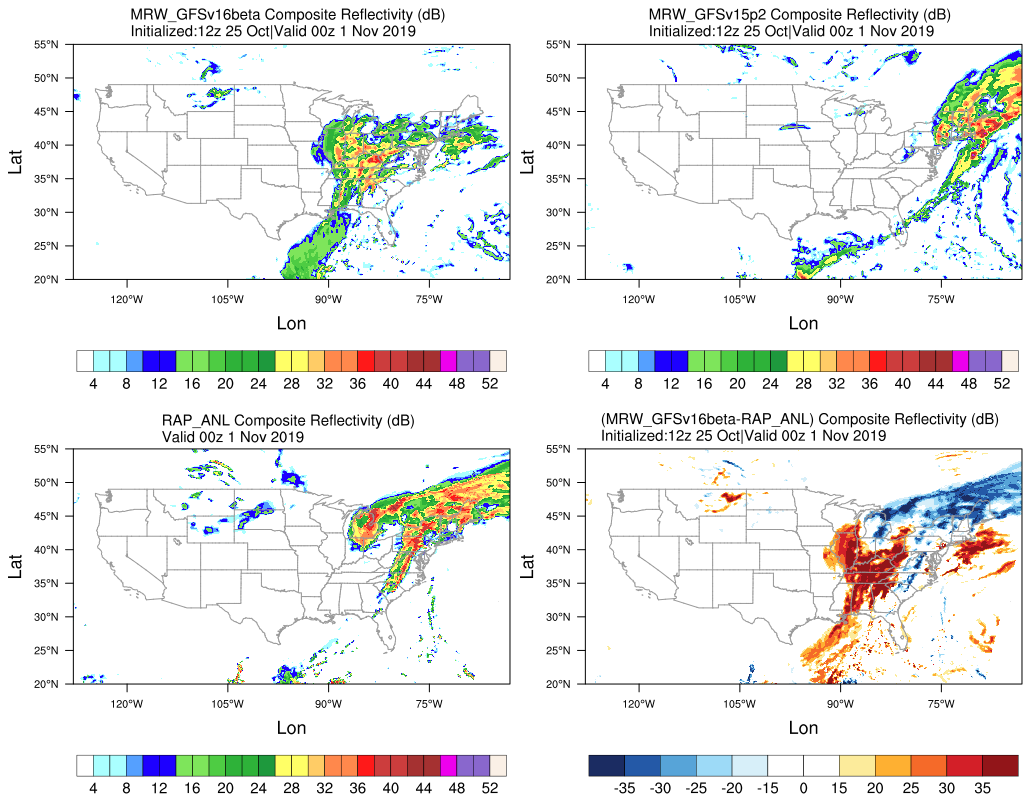
Composite reflectivity (dB) valid at 00z 1 Nov 2019
The precipitation location lags behind the MRW_GFSv16beta compared with RAP_ANL, while the precipitation location moves further northeastwards in MRW_GFSv15p2 compared with RAP_ANL.
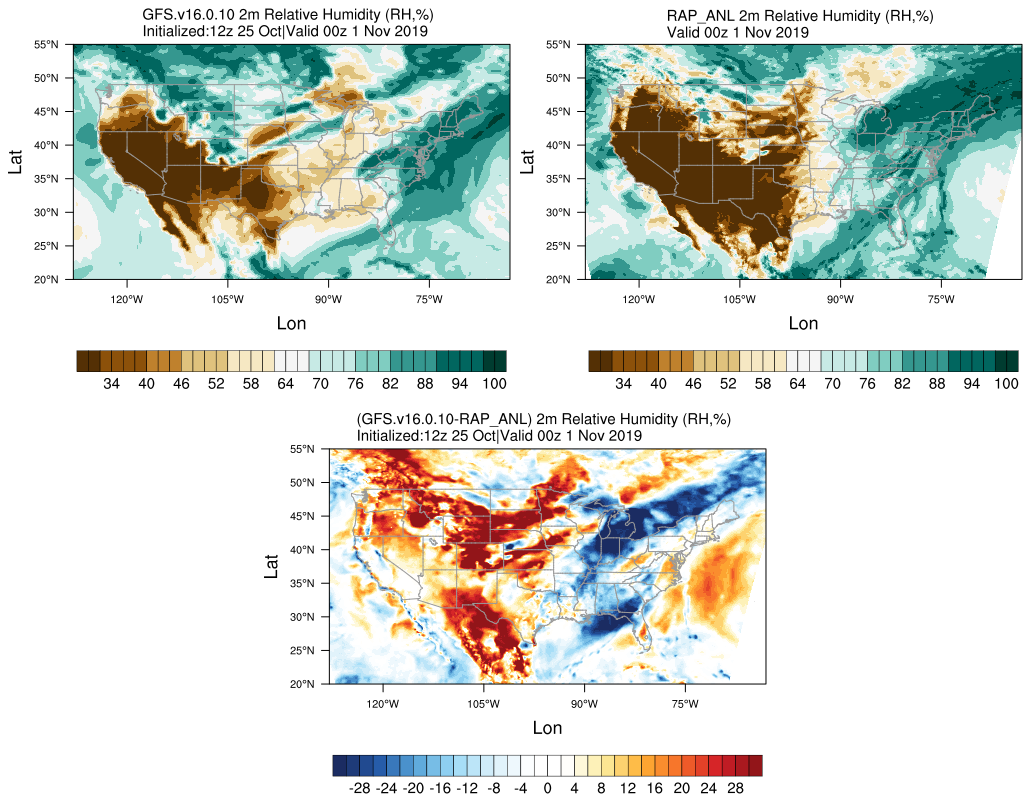
2-m relative Humidity (RH,%) valid at 00z 1 Nov 2019
The dryline across the middle U.S. blurs out in GFS.v16.0.10.
Dry bias over the Eastern U.S. and wet bias over the Western U.S.
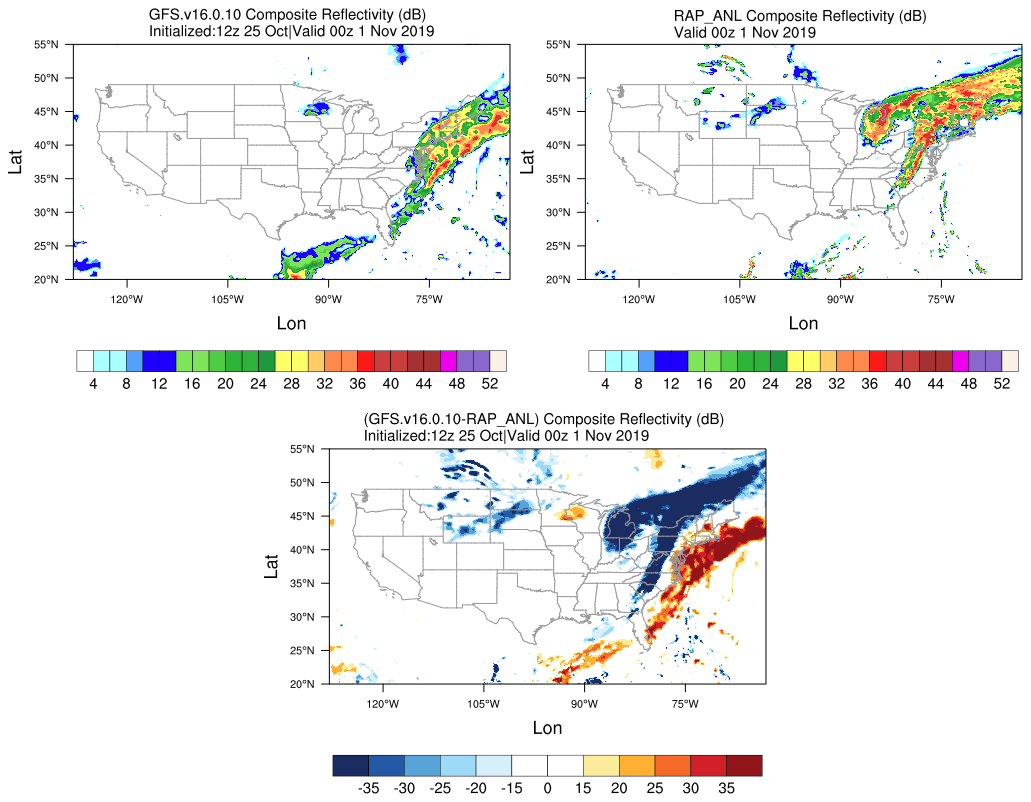
Composite reflectivity (dB) valid at 00z 1 Nov 2019
Lower composite reflectivity values suggest less intensive precipitation over the Northeastern U.S.
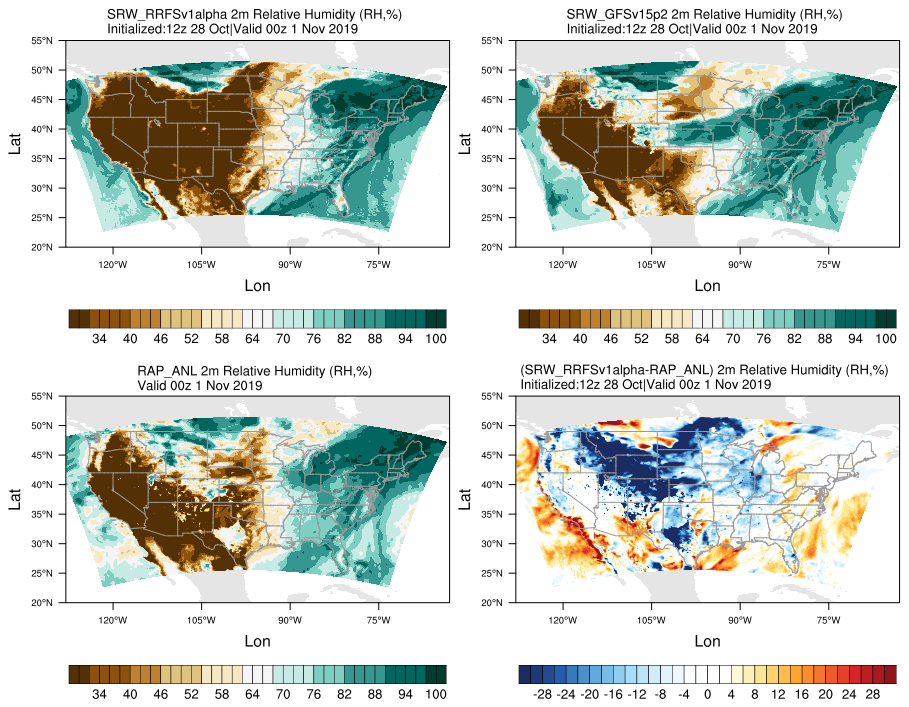
2-m relative Humidity (RH,%) valid at 00z 1 Nov 2019
Dryline across the central U.S. is not simulated well in the two physics compsets.

Composite reflectivity (dB) valid at 00z 1 Nov 2019
The rainband orientation in SRW_RRFSv1alpha and SRW_GFSv15p2 is slightly different than that in RAP_ANL. The results from SRW_GFSv15p2 is sligtly stronger and better than that from SRW_RRFSv1alpha.
5.3. Summary and Discussion
MRW_GFSv15p2 generates a progressive synoptic pattern during the 2019 Halloween Storm, while MRW_GFSv16beta generates a regressive synoptic pattern compared with GFS analysis data. GFS.v16.0.10 alleviates the progressiveness of MRW_GFSv15p2 but still generates a cold bias along the U.S. east coast. Major changes in GFS.v16 from GFS.v15 can be referred to Yang (2020). The sea level structure in SRW_GFSv15p2 is more reasonably simulated than that in SRW_RRFSv1alpha. The MSLP and 500mb Height from SRW_RRFSv1alpha are very noisy. The SRW App forecasts have shorter duration because of limitations in the availability of lateral boundary conditions for longer lead times.
References
Yang F. (2020). Development and evaluation of NCEP’s Global Forecast System Version 16. Unified Forecast System Community Webinar, Oct 22, 2020. [Link]